About
Our five-yearly ecological outcomes reports outline our progress and show how we're tracking against our goals for each species and ecosystem. Scientists from the Arthur Rylah Institute conduct monitoring for the MSA Program, and they look at measures like population counts and weed levels.
Take a look below to see the key findings for the Ecological Outcomes Report (2014 to 2020) or view the PDF document below.
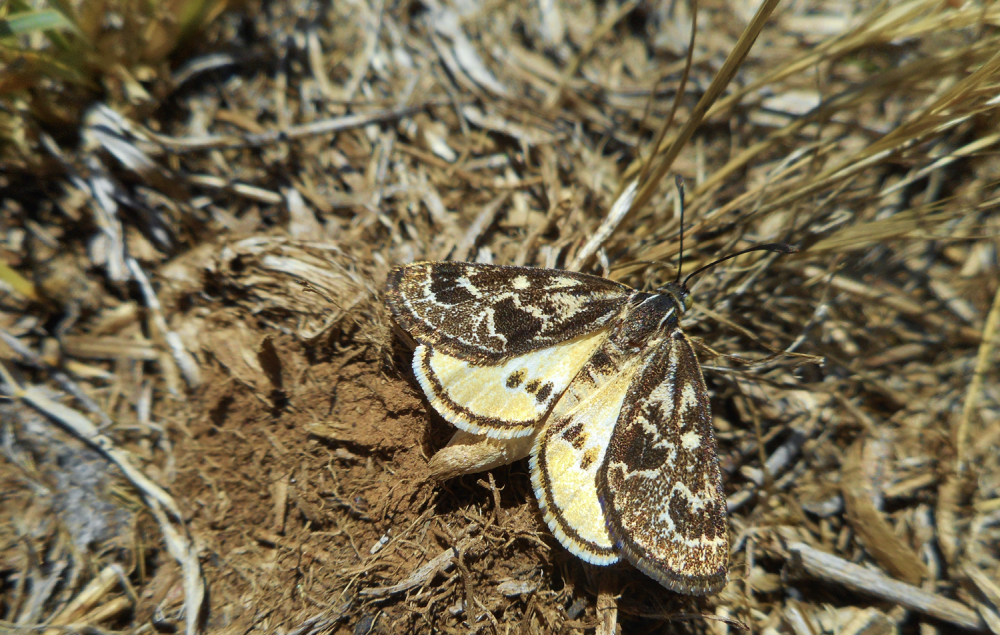
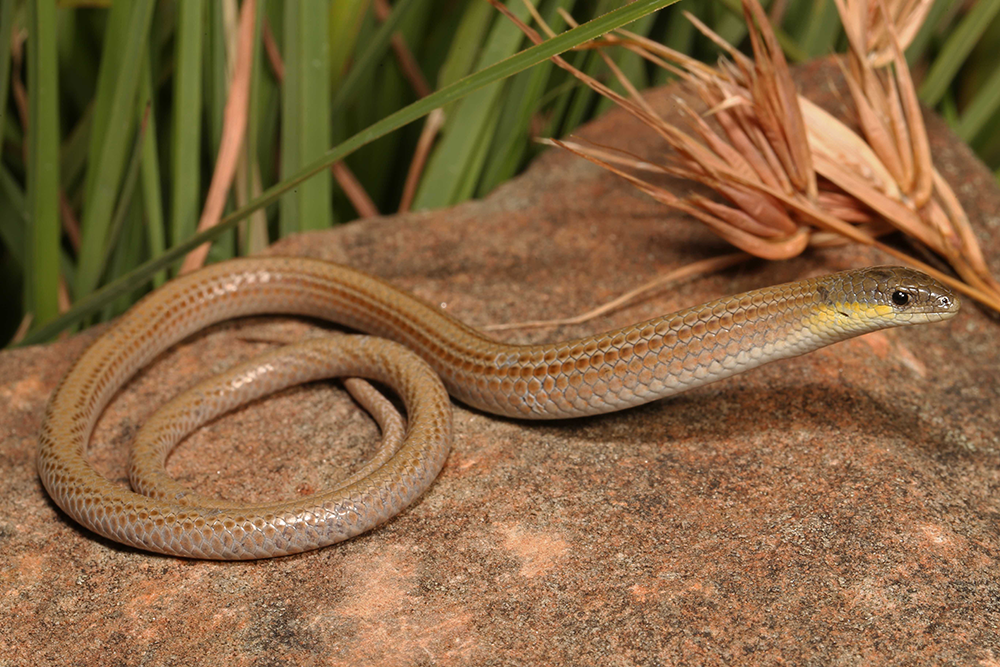
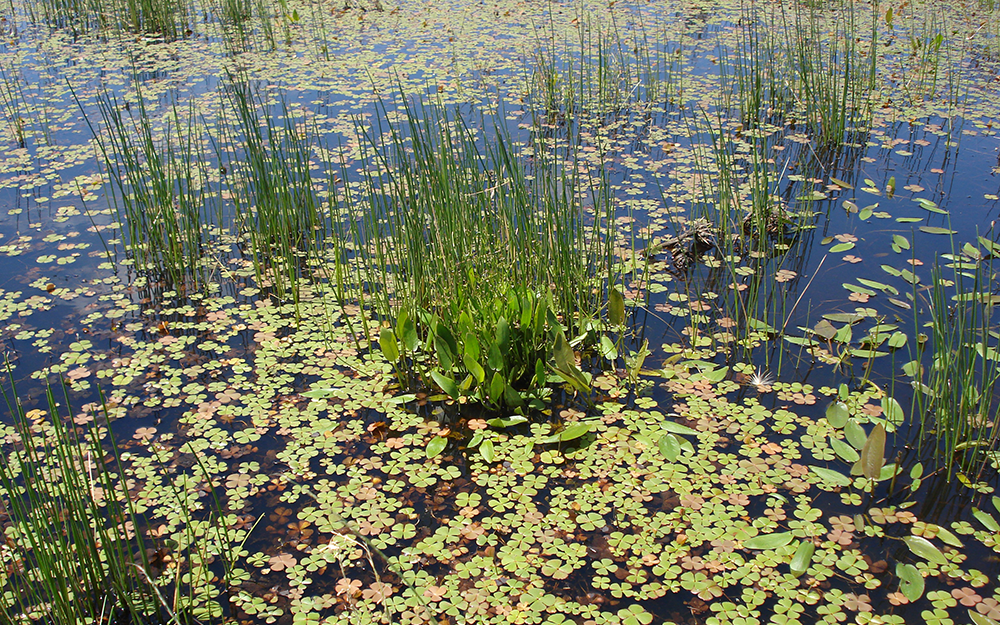
For the 2014 to 2020 period, we found that for golden sun moth, striped legless lizard, natural temperate grassland and seasonal herbaceous wetland, all our targets were met.
For the other species and ecosystems, too few locations or not enough time under MSA Program management meant that we didn't have enough data to set a baseline. A baseline is like a starting point for any research - it's important as it helps us track our progress.
Over the coming years, more conservation sites will be transferred into the MSA Program, which means increased monitoring, better data and more detailed reporting
Methods
To ensure each species and ecosystem has the best chance of survival, the conservation areas are managed to maintain the appropriate habitat, using techniques such as ecological burning and weed control. We also use an adaptive management approach.
This means techniques are adjusted and tweaked over time, depending on what’s working well for each species and ecosystem. In short – we repeat successes and avoid making the same mistakes.
Finally, each species and ecosystem is monitored regularly in the field, using the most suitable techniques and methods.
How we measure progress
Each species and ecosystem has a single conservation goal and one or more targets that show how we will achieve that goal – we measure our progress against the goal by tracking these targets. Most targets need each species or ecosystem to remain above a baseline (in cases where we want high measurements, such as the population number of threatened species) or below a baseline (in cases where we want low measurements, such as the amount of weeds).
Reporting results
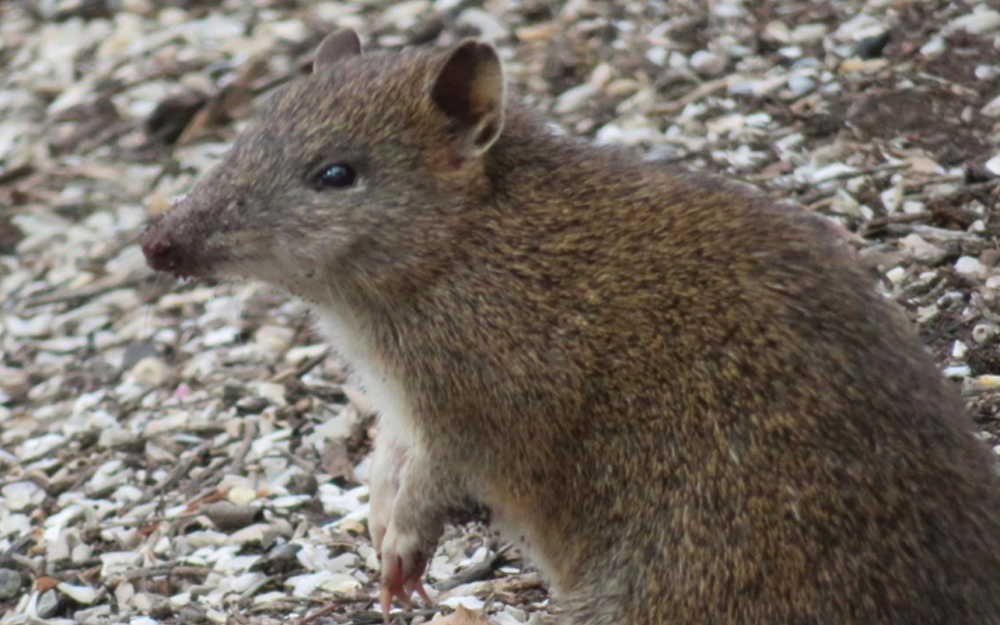
For most species and for wetlands, results are reported separately for different locations. We have a single measure for all locations for the southern brown bandicoot and golden sun moth. This helps determine if the improvement is consistent or mixed and lets us compare results for different sites under different management regimes.
Newly-discovered populations of EPBC-listed species are also monitored. For the grassland and woodland ecosystems, results are reported separately according to ‘states.’ States are areas of different status within each ecosystem (such as different history or quality).
Reporting on each state helps us understand if the improvement is even or mixed and allows us to have different baselines for different states.
What do the results tell us?
Change in the condition of vegetation and the population of species is usually very slow. Sometimes, it can be hard to separate what influence our management actions are having versus natural influences, such as floods or bushfires. Collecting data over a long period helps us see environmental trends.
All of the species and ecosystems we monitor are threatened and have been in decline since European settlement. We don’t have any site-specific data on the rate of decline before we took over management of these areas. However, we can use monitoring data to set a baseline to understand if our management is stopping any further decline and stabilising populations and beginning to increase populations or the condition of the ecosystems.
It’s important that we remain focused on achieving our conservation goals. We use this data in an adaptive management approach that ensures land management decisions and on-ground actions are responsive to the results of this monitoring.

